


The most widely used retirement benchmarks, from Fidelity’s guidelines, say you should have 1x your salary saved by 30, 3x by 40, 6x by 50, on the way to 10x by 67. This article lays out those targets, the assumptions hiding underneath them, and the uncomfortable, oddly comforting truth the benchmark articles skip the median American is behind every one of these numbers at every age, often dramatically. Then it covers the catch-up mechanics that actually move the needle, including 2026’s contribution limits, the largest in history: $24,500 base, $32,500 with the age-50 catch-up, and $35,750 for the new age-60-to-63 “super catch-up.” These are educational benchmarks, not verdicts, and not personalized advice; your real target depends on your income, spending, and timeline, which is a conversation for a fiduciary advisor. But knowing where you stand beats not knowing, every time.
There’s a particular feeling that hits people when they first look up how much they’re “supposed” to have saved by their age, and it’s usually somewhere between a cold flush and a short laugh. The benchmark says six times your salary and you’re looking at an account that holds eight months of it. If that’s you, I want to tell you two things before any numbers: first, you are statistically normal, the median American is below these targets at every single age. Second, the honest response to being behind isn’t despair or denial, it’s understanding which levers actually close the gap, because a few of them are far more powerful than people realize, and the tax code hands you bigger ones as you get older. So let’s do the numbers straight, and then the catching up.
The Benchmarks, And What They Secretly Assume
The salary-multiple ladder everyone cites comes from Fidelity’s retirement guidelines, and it runs like this: 1x your annual salary saved by age 30, 3x by 40, 6x by 50, 8x by 60, and 10x by 67, with half-steps in between (2x by 35, 4x by 45). “Saved” means all retirement accounts, 401(k), IRA, pension value, not home equity.
Two things about this ladder that the listicle versions never explain. First, the assumptions underneath: the model presumes you retire at 67, want to replace roughly 70 to 80 percent of your pre-retirement income, and that Social Security carries a meaningful chunk, about 40 percent of income for a median earner, with your savings covering the rest across a 25-to-30-year drawdown. Change any assumption, retire at 60, live on less, earn much more than median (Social Security replaces less of a big income), and your true multiple shifts. The benchmark is a well-built average, not your number.
Second, notice the ladder is not linear. It goes from 4x at 45 to 6x at 50, two full salary multiples in five years, and that jump is deliberate: the model assumes your peak earning years are also your peak saving years. Which is precisely why the years between 45 and 55 feel so heavy, the target is accelerating exactly when the mortgage and the kids’ tuition are loudest.
The Honest Context: Almost Everyone Is Behind
Now the part these articles bury, which I think is the most important data in the whole topic. Set the benchmarks against what Americans actually have, per the Federal Reserve’s Survey of Consumer Finances and Fidelity’s own participant data:
- At 30, the target is 1x salary. The median retirement balance for under-35s is about $18,880, roughly 67 percent below the benchmark on a median income.
- At 40, the target is 3x, $225,000 on a $75,000 salary. The average 40-something holds about $104,000, less than half the mark.
- At 50, the target is 6x. The median 45-to-54-year-old has around $87,000 saved against a $450,000 benchmark on that same $75,000 salary.
Read those and the takeaway is not “everyone is doomed.” It’s that the benchmarks describe an ideal trajectory that most real lives, with their layoffs, medical bills, divorces, and late starts, don’t trace, and being behind puts you in the majority, not in a failure category. The reason to know your number anyway is simple: the gap is only actionable once it’s measured. Not knowing feels safer and costs more.
Catching Up In Your 30s And 40s: The Boring Levers Are The Big Ones
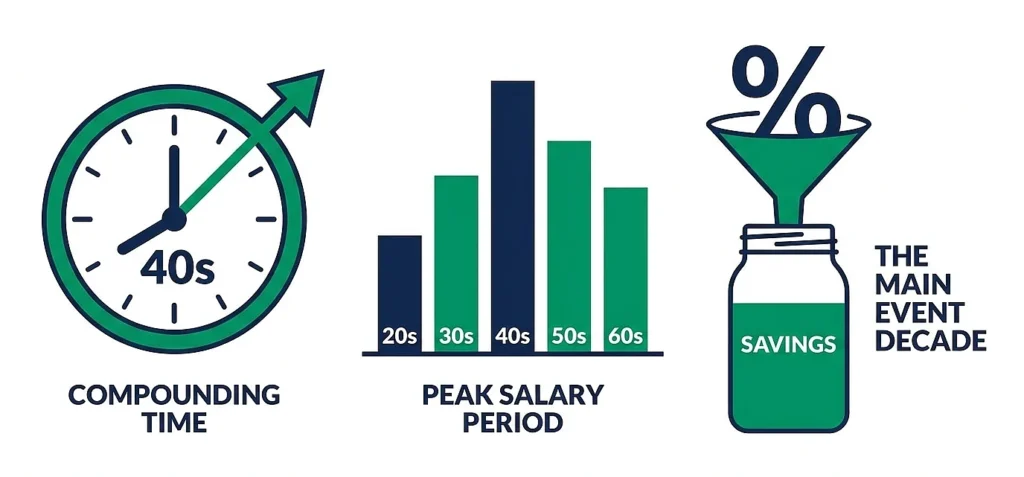
If you’re behind at 30 or 40, your most powerful asset isn’t a clever investment, it’s the two or three decades of compounding still ahead, which is why the effective moves at this stage are unglamorous and rate-based:
- Capture the full employer match before anything else. It is an instant, guaranteed return on contributions, and leaving it unclaimed is the most common self-inflicted wound in retirement saving.
- Raise your savings rate one point at every raise. The standard target is around 15 percent of income including the match; almost nobody starts there, and ratcheting up with raises gets you there without ever feeling the cut.
- In your 40s, treat the decade as the main event. Peak salary plus 25 years of compounding left makes every extra percentage point saved now disproportionately valuable, the arithmetic of this decade beats any decade after it.
- Mind the 2026 ceiling, which most people never approach: the employee 401(k) limit is $24,500 this year, with IRA room on top ($7,500, or $8,600 at 50-plus). If you’re a high earner behind on the benchmarks, the limits are rarely your binding constraint, your rate is.
Catching Up At 50 And Beyond: The Tax Code Finally Takes Your Side
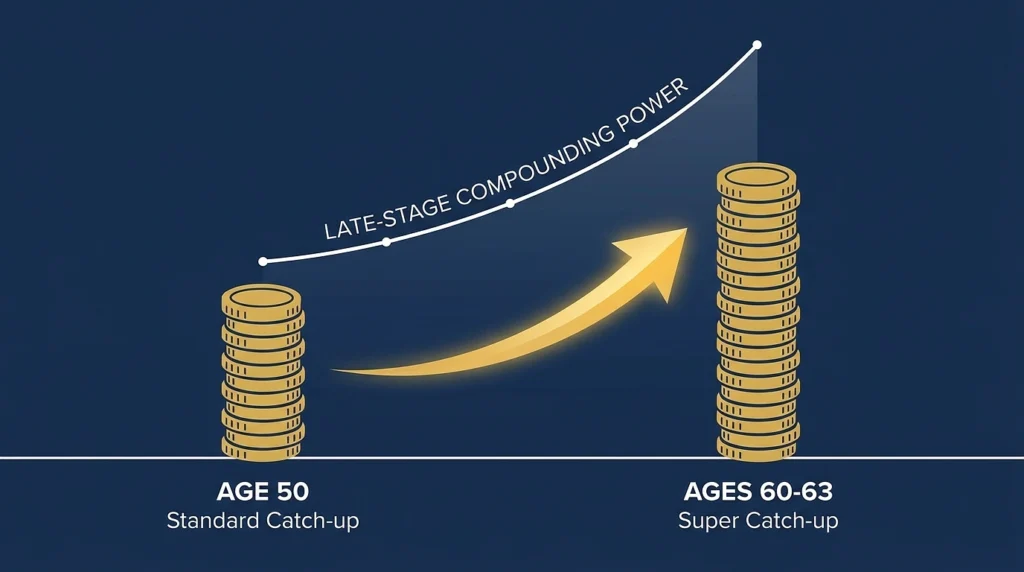
Here’s the genuinely encouraging structural fact for anyone staring at that 6x-at-50 benchmark from well below it: age 50 is when the contribution rules start bending in your favor, and the current rules are the most generous ever written.
At 50, the standard catch-up kicks in: an extra $8,000 on top of the base limit, for a total of $32,500 a year into a 401(k) in 2026. And the compounding math on that is not small: consistently contributing at that level from 50 to 65 can add over $700,000 to a balance at a 7 percent growth assumption. Fifteen years is still a long time in marketing terms, which is the thing the panic at 50 always forgets.
At 60 through 63, the SECURE 2.0 Act’s new “super catch-up” replaces the standard one: $11,250 extra, for a total of $35,750 a year, if your plan allows it, the highest limit in 401(k) history, and a window that closes at 64. IRAs add their own catch-up on top. And beyond contributions, the other big lever at this stage is timing: each year you delay claiming Social Security past full retirement age increases the benefit, and modeling that timing, along with withdrawal order and required distributions, is where a few hours with a fee-only fiduciary advisor genuinely earns its cost, because these are individual-situation decisions no benchmark article can make for you.
What To Actually Do With All This
The honest sequence, whatever your age: find your real number (an hour with a retirement calculator using your actual salary and balances tells you more than any rule of thumb), capture the match, set the savings rate on autopilot with annual increases, and use the age-based catch-ups the moment they open. If the gap is large or the decisions are getting complicated, retirement date, Social Security timing, tax treatment, that’s when to bring in a fee-only fiduciary advisor rather than guessing, because the benchmarks can tell you roughly where you stand, but only your full picture can say what to do about it.
And keep the benchmarks in their place. They’re goalposts built on a median life, useful for orientation and useless as a judgment. The median American is behind them and still retires; the person who measures the gap at 42 and adds two points to their savings rate does meaningfully better than the one who couldn’t bear to look until 58. The scariest thing about these numbers was never the numbers. It’s the not-looking, and you’ve just done the looking, which is genuinely the hardest step in the whole process.

